


This post was republished with permission from Zero Hedge
Between persistent inflation, trade wars, and AI-related job disruptions, the outlook on the U.S. economy is once again ticking to “uncertain.”
If things get worse and unemployment starts to tick up, then more Americans might be forced to rely on state support to make ends meet.
But what’s the current picture? How many families in the country are already in need of benefits?
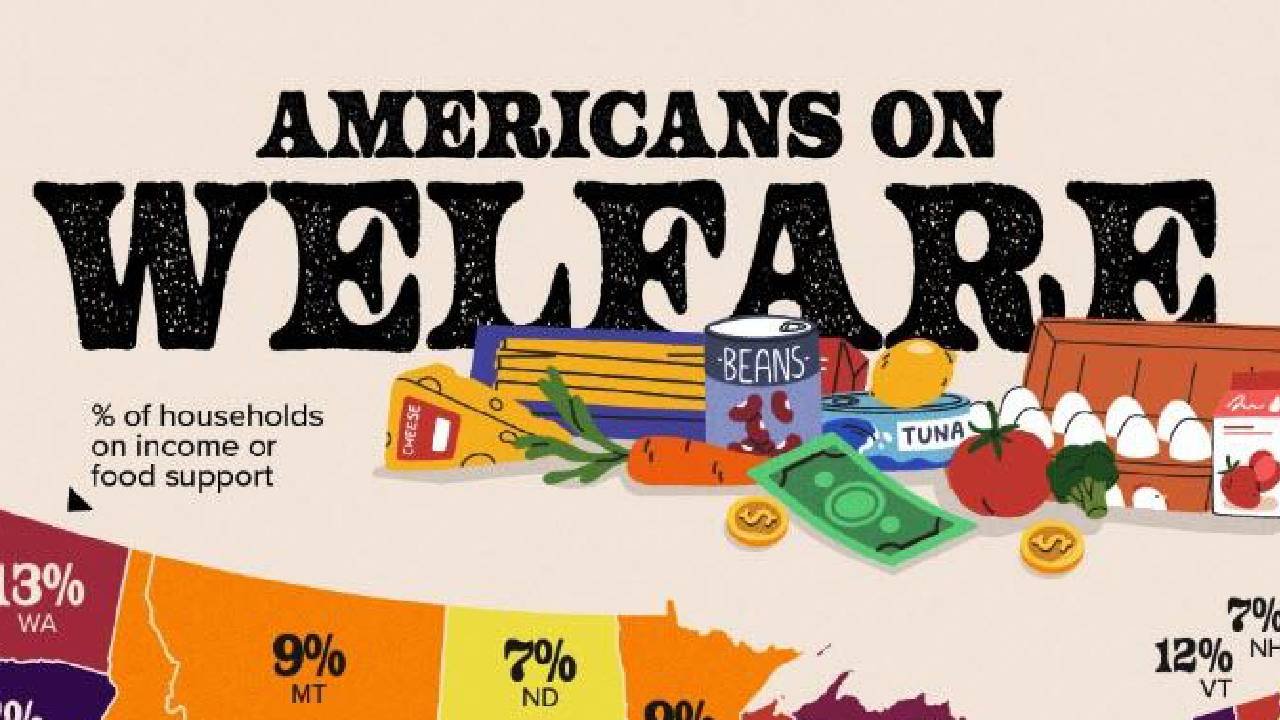
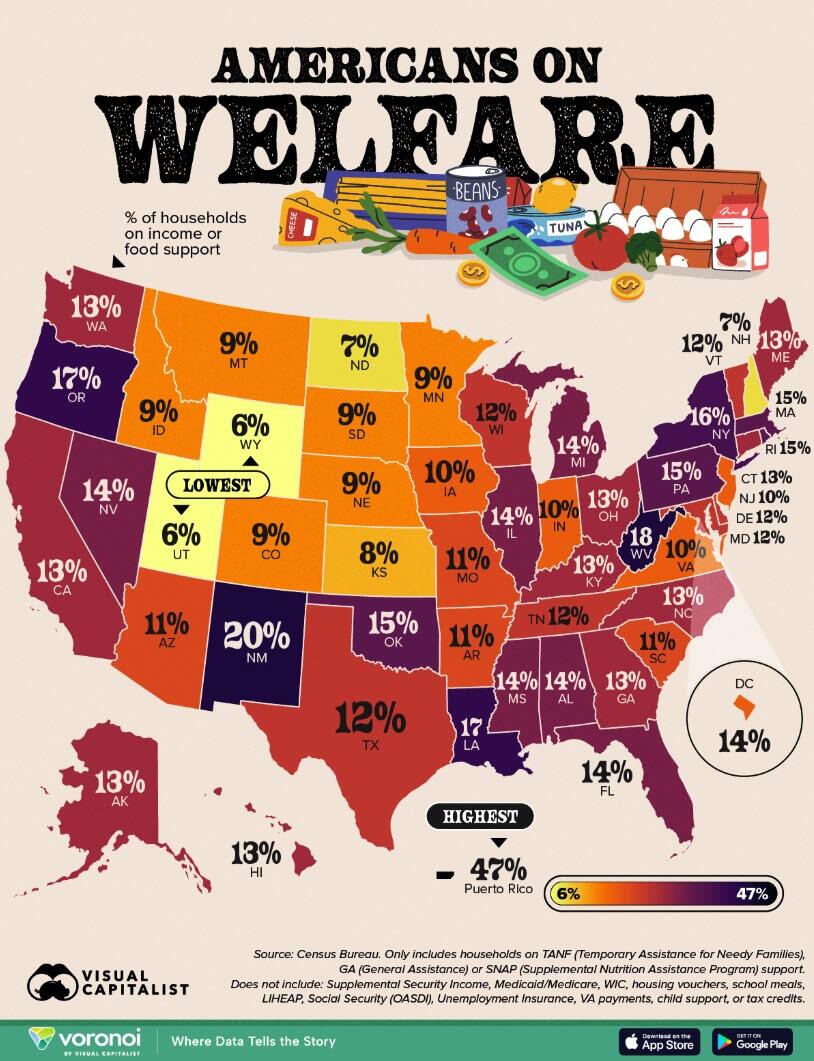
This map, via Visual Capitalist’s Pallavi Rao, shows the share of households in each state that reported receiving cash public assistance (also known as TANF, Temporary Assistance for Needy Families) or food assistance (also known as SNAP, Supplemental Nutrition Assistance Program) in 2023.
The data for this visualization comes from the U.S. Census Bureau’s. Figures are rounded.
Ranked: U.S. Households on Welfare by State
Puerto Rico stands out with 47% of households receiving assistance.
This reflects sustained economic challenges and unique territorial program structures.
| Rank | State or Jurisdiction | Code | Share of Households on Welfare | # of Households on Welfare |
|---|---|---|---|---|
| 1 | Puerto Rico | PR | 47% | 586K |
| 2 | New Mexico | NM | 20% | 162K |
| 3 | West Virginia | WV | 18% | 129K |
| 4 | Louisiana | LA | 17% | 308K |
| 5 | Oregon | OR | 17% | 284K |
| 6 | New York | NY | 16% | 1253K |
| 7 | Massachusetts | MA | 15% | 418K |
| 8 | Oklahoma | OK | 15% | 224K |
| 9 | Pennsylvania | PA | 15% | 787K |
| 10 | Rhode Island | RI | 15% | 67K |
| 11 | Alabama | AL | 14% | 277K |
| 12 | District of Columbia | DC | 14% | 46K |
| 13 | Florida | FL | 14% | 1157K |
| 14 | Illinois | IL | 14% | 723K |
| 15 | Michigan | MI | 14% | 571K |
| 16 | Mississippi | MS | 14% | 162K |
| 17 | Nevada | NV | 14% | 162K |
| 18 | Alaska | AK | 13% | 35K |
| 19 | California | CA | 13% | 1748K |
| 20 | Connecticut | CT | 13% | 182K |
| 21 | Georgia | GA | 13% | 524K |
| 22 | Hawaii | HI | 13% | 63K |
| 23 | Kentucky | KY | 13% | 240K |
| 24 | Maine | ME | 13% | 76K |
| 25 | North Carolina | NC | 13% | 553K |
| 26 | Ohio | OH | 13% | 641K |
| 27 | Washington | WA | 13% | 382K |
| 28 | Delaware | DE | 12% | 46K |
| 29 | Maryland | MD | 12% | 279K |
| 30 | Tennessee | TN | 12% | 329K |
| 31 | Texas | TX | 12% | 1322K |
| 32 | Vermont | VT | 12% | 32K |
| 33 | Wisconsin | WI | 12% | 282K |
| 34 | Arizona | AZ | 11% | 311K |
| 35 | Arkansas | AR | 11% | 132K |
| 36 | Missouri | MO | 11% | 264K |
| 37 | South Carolina | SC | 11% | 230K |
| 38 | Indiana | IN | 10% | 262K |
| 39 | Iowa | IA | 10% | 131K |
| 40 | New Jersey | NJ | 10% | 342K |
| 41 | Virginia | VA | 10% | 320K |
| 42 | Colorado | CO | 9% | 215K |
| 43 | Idaho | ID | 9% | 63K |
| 44 | Minnesota | MN | 9% | 201K |
| 45 | Montana | MT | 9% | 42K |
| 46 | Nebraska | NE | 9% | 69K |
| 47 | South Dakota | SD | 9% | 32K |
| 48 | Kansas | KS | 8% | 90K |
| 49 | New Hampshire | NH | 7% | 39K |
| 50 | North Dakota | ND | 7% | 24K |
| 51 | Utah | UT | 6% | 68K |
| 52 | Wyoming | WY | 6% | 14K |
Among the states, New Mexico has the highest share at 20%, followed by West Virginia (18%), Oregon (17%), Louisiana (17%), and New York (16%).
A large cluster of state jurisdictions have low?to?mid teens of U.S. households on welfare.
And at the other end, Utah and Wyoming are lowest at 6%, with New Hampshire and North Dakota at 7% and Kansas at 8%.
Regional Patterns and Notable Outliers
Appalachia and parts of the South post elevated welfare participation, mirroring higher poverty rates in the region.
However, even the richer Northeast has several higher?than?average states with households on benefits.
This includes Massachusetts, Pennsylvania, and Rhode Island (each 15%), alongside low New Hampshire (7%).
Meanwhile, on the West Coast, Oregon is an outlier at 17%, while California and Washington are closer to the national middle at 13%.
Overall, the median across the 50 states, D.C., and Puerto Rico is 13%, showing most places cluster in a narrow band.
Policy Design Matters for Welfare Access
Safety?net participation reflects more than local poverty rates.
For example, SNAP is federally funded but state?administered, and states differ in outreach, enrolment ease, and recertification cadence.
Cash assistance (often via TANF) is a capped block grant, and states set their own eligibility thresholds and work rules, which can meaningfully raise or lower participation.
States Will Have to Start Paying for Food Stamp Programs
Per reporting from Politico, Trump’s recent megabill has slashed federal funding for safety net programs and pushes food aid costs to the states.
Draft proposals would require states to cover between 5% and 25% of benefit costs starting in 2028 and pick up 75% of administrative expenses.
This marks a major change from today, where the federal government funds SNAP benefits entirely.
As a result states with higher participation and elevated error rates would face the greatest budget implications if these plans are implemented.
Your support is crucial in helping us defeat mass censorship. Please consider donating via Locals or check out our unique merch. Follow us on X @ModernityNews.
More news on our radar
Weird that Puerto Rico is included but American Samoa, Guam, the Northern Mariana Islands, or the U.S. Virgin Islands.